Explore our expert-made templates & start with the right one for you.
Table of contents
A Guide for Data Engineering Leaders
What is a Data Pipeline?
A data pipeline is a process for moving data between source and target systems. Data pipelines are used to replicate, move, or transform data, or simply to connect two disparate APIs, in order to ensure data is available when, where and in the form that it is needed.
Discover the power of continuous SQL pipelines with Upsolver. Start for free
Types of data pipelines
Data engineering is a rapidly growing field, and much of its focus is on making data available by maintaining a robust data pipeline architecture. Every new data pipeline is its own build vs. buy decision – do you write code to extract and transform data, or do you use a proprietary tool or system?
Open-source frameworks such as Apache Airflow and Spark, among others, offer ways to build and manage transformation pipelines. These tools offer a high degree of flexibility but also require you to write detailed execution plans. They are intricate systems that are difficult to master and thus typically require specialized engineering resources to configure and maintain.
An alternative is to choose a declarative data pipeline tool that allows you to use a common language like SQL to specify the shape of the desired output table and automates much of the engineering required to move the data and execute the transformations. While this approach sacrifices a certain level of control, it requires less time and a lower level of engineering skill to build the pipeline. It enables you to make your data engineering more productive as well as focus data engineering resources on other high-value projects such as developing new features.
What are common examples of data pipelines?
Data pipelines are ubiquitous in analytics and software development, and can be as simple as a drag-and-drop operation or complex enough to require thousands of lines of code. Some archetypal examples include:
Delivering data to data-driven apps: Many modern applications generate value by responding to data in real time. For example, a cybersecurity application might analyze terabytes of network traffic to pinpoint anomalous behavior as it occurs and alert analysts that a breach might have occured. In order to do so, these applications require a stream of fresh, queryable data.
A real-time data pipeline would ingest a stream of logs captured from servers, networks or end devices, transform it into analytics-ready formats, and make it available for the app to query.
Improving performance and reducing costs of analytics architectures: The abundance of digital systems and applications make it easier than ever for organizations to accumulate large volumes of data. While much of this data might prove useful, storing it in a cloud database can prove prohibitively expensive. For example, a company that analyzes user behavior on its mobile apps might run into drastically higher storage and compute costs if a new feature drives increased app installations or more complex usage patterns.
Data lake pipelines can be used to reduce data warehouse costs as well as improve query performance by transforming raw data on a data lake into smaller analytics-ready tables that can be outputted to the data warehouse. In general, the data lake will provide much less expensive processing.
Centralizing data from disparate business systems: Nowadays, even smaller companies typically work with multiple data-generating applications. For example, a marketing department at a 100-person company might have web analytics, CRM, advertising and product log data. Data pipelines extract the data from each application and load it into a centralized repository such as a data warehouse, where it can be joined for further analysis and reporting.
This type of use case is becoming commoditized, with dozens of data integration and business intelligence tools offering solutions for common scenarios where data from several third-party sources needs to be joined.
Check our data pipeline examples for detailed, step-by-step tutorials covering real-life use cases.
ETL vs ELT data pipelines
The analytics and data management landscape has become more sophisticated over the years, and offers many different ways to work with data. The question of ETL vs ELT boils down to where you are running the transformation workload.
ETL stands for extract, transform, and load. Meaning, the transformation is happening after the data has been extracted from the source system but before it is loaded into the target system. In this case, the transformation would be handled within the data pipeline platform itself, typically by relying on an in-memory engine to aggregate, join and manipulate data.
In an ELT pipeline, the order has changed: extract, load and transform. In this case the data is loaded into the target system – typically a powerful modern database – and then transformed with the database’s compute power. Data pipeline tools can be used to ensure schema consistency and to allow developers to manage the flow of data with minimal coding.
Both ELT and ETL patterns can be found in modern data architecture. Read more about ETL pipelines for data lakes.
What are the challenges of building data pipelines?
The main challenge with data pipelines is ensuring your pipeline performs consistently at larger scales and dealing with changes to underlying data sources and requirements of data consumers. It’s simple enough to write code to move a daily batch of data from an application to a database – but what happens when you want to add additional fields, a new data source, or reduce refresh time from a day to an hour? What about changes to business rules or application logic that requires you to rerun your pipelines?
The need to constantly manage, update and troubleshoot pipelines leads to data engineers becoming overwhelmed with ‘data plumbing’ – constantly chasing the latest bug, recovering from a pipeline crash, or addressing dropped data. This can be especially painful and time-consuming when working in a data lake architecture, when dealing with schema evolution, or when working with real-time data streams.
You can learn more about data pipeline challenges and how to overcome them in this recorded talk by Upsolver CEO:
(If you prefer words to moving pictures, check out this blog instead)
What is a streaming data pipeline? How does it differ from batch?
A streaming data pipeline continuously processes data as it is being generated, allowing for real time or near-real time access to data from streaming sources such as sensors, mobile devices, and web applications. While batch processing is based on waiting for a certain amount of data to accumulate before running a workload (e.g., every hour or every day), in a streaming pipeline data is moved as it is generated at the source in order to increase availability and freshness.
How to Build a Real-time Streaming ETL Pipeline
Now that we’ve covered the basics, let’s talk about how you approach building streaming data pipelines.
From an engineering perspective, the nature of real-time data requires a paradigm shift in how you build and maintain your ETL data pipeline. This type of is data is continuously streamed in very expected loads, however, the structure of the data may change in the same frequency.
Streaming architecture
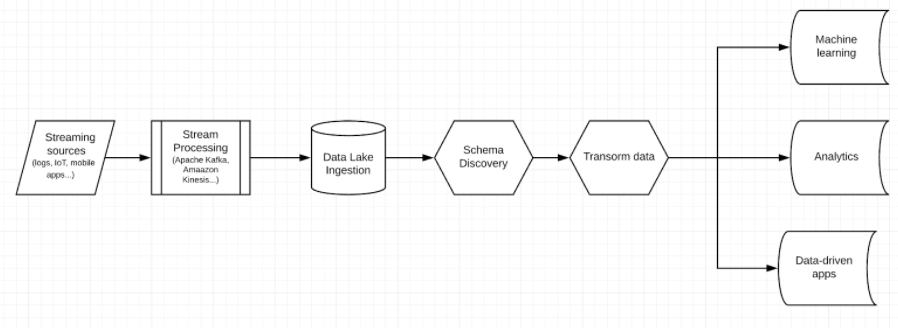
To start with, you need to stream your real-time data into a streaming platform – a message broker that processes streaming events from client apps or devices and ensures it is sent to target storage systems. There are many to choose from. If you’re uncertain which to choose, use one of the popular streaming platforms such as Apache Kafka and Amazon Kinesis. (See our comparison of Kafka vs RabbitMQ).
Benefits of stream processing
- Data freshness/latency – since you are processing one event at a time in real-time or near real-time, your data is always fresh.
- Cost – no need to run large operations on small servers. This helps keep your processing footprint small and, as a result, your cloud bill, as well. You have a very small amount of processing at every single point in time since you’re typically only working with the latest events.
You can read more about stream, batch and micro-batch processing here.
Storage
Once you have a stream of incoming events, you need to store it somewhere. One option would be to use a traditional database. However, choosing that option limits your flexibility (since you have to commit to a certain schema) and the storage costs would be high.
Another option would be storing your data in a data lake. Data lakes are based on object storage services such as Amazon S3 and Google Cloud Storage. These are cheap and reliable options to store data in the cloud. This is the best choice for handling high volumes of streaming data, since object storage fits in nicely with this type of fluid and often only partially-structured data.
Amazon S3 is schema-agnostic. It doesn’t care about data formats and structure – you can just store whatever data you want and it deals with it perfectly and at a low cost. It’s important to store the data in the lake in an optimal manner. For example: avoid small files and use the best optimal format for your use case (read more about dealing with small files on S3).
Schema Discovery
While S3 is an excellent and low-cost option for storage, it doesn’t give you tools to manage schema, which means you’re not always sure exactly what’s going into your lake. Maintaining a schema layer on top of your data lake helps you maintain control and avoid “data swamp” scenarios. The solution for that is either to develop a schema management tool yourself or use off-the-shelf tools to do it such as Upsolver Data Lake ETL, which provides automatic schema on read. Read more about using schema discovery to explore streaming data.
Data Preparation for Analytics
So you have your data ingested into a data lake, and you know how it’s structured. Nice work! However, this is probably not the end of the task; you probably want to do something with your data, such as running analytics queries, running machine learning flows, or even just storing a subset of the data in a database.
Here comes the transformation phase in the ETL process. As with every ETL, moving your data into a queryable state is a concern for the real-time use case as well.
As we’ve previously seen, streaming data comes in several forms (such as hierarchical JSON) and shapes (such as various file formats: CSV, TSC, Parquet, AVRO, and so on). And a single stream of real-time data may change over time, as well. Since we are dealing with real-time data such changes might be frequent and could easily break your ETL pipeline. So for transforming your data you need either to use a data lake ETL tool such as Upsolver or code your own solution using Apache Spark, for example.
When you’re done moving your data into a queryable state, you need to distribute it to one or more targets, depending on your use case. This can be done using tools such as Apache Airflow, which requires some expertise and coding, or you can develop your own orchestration tool by yourself using Spark.
Building Real-time ETL Pipelines in Upsolver
Let’s look at an example use case in which you want to turn your real-time streaming data from Kinesis into queryable data, and send it to Athena. We will walk you through the process of how you can do this in Upsolver in just 3 steps.
Step 1: Extract real-time streaming data from Kinesis
This step is also known as the ETL data ingestion process. We load the real-time streaming data from Kinesis to Upsolver’s data lake. The data is stored in Amazon S3.
Step 2: Transform the data into a queryable state (using the UI or SQL)
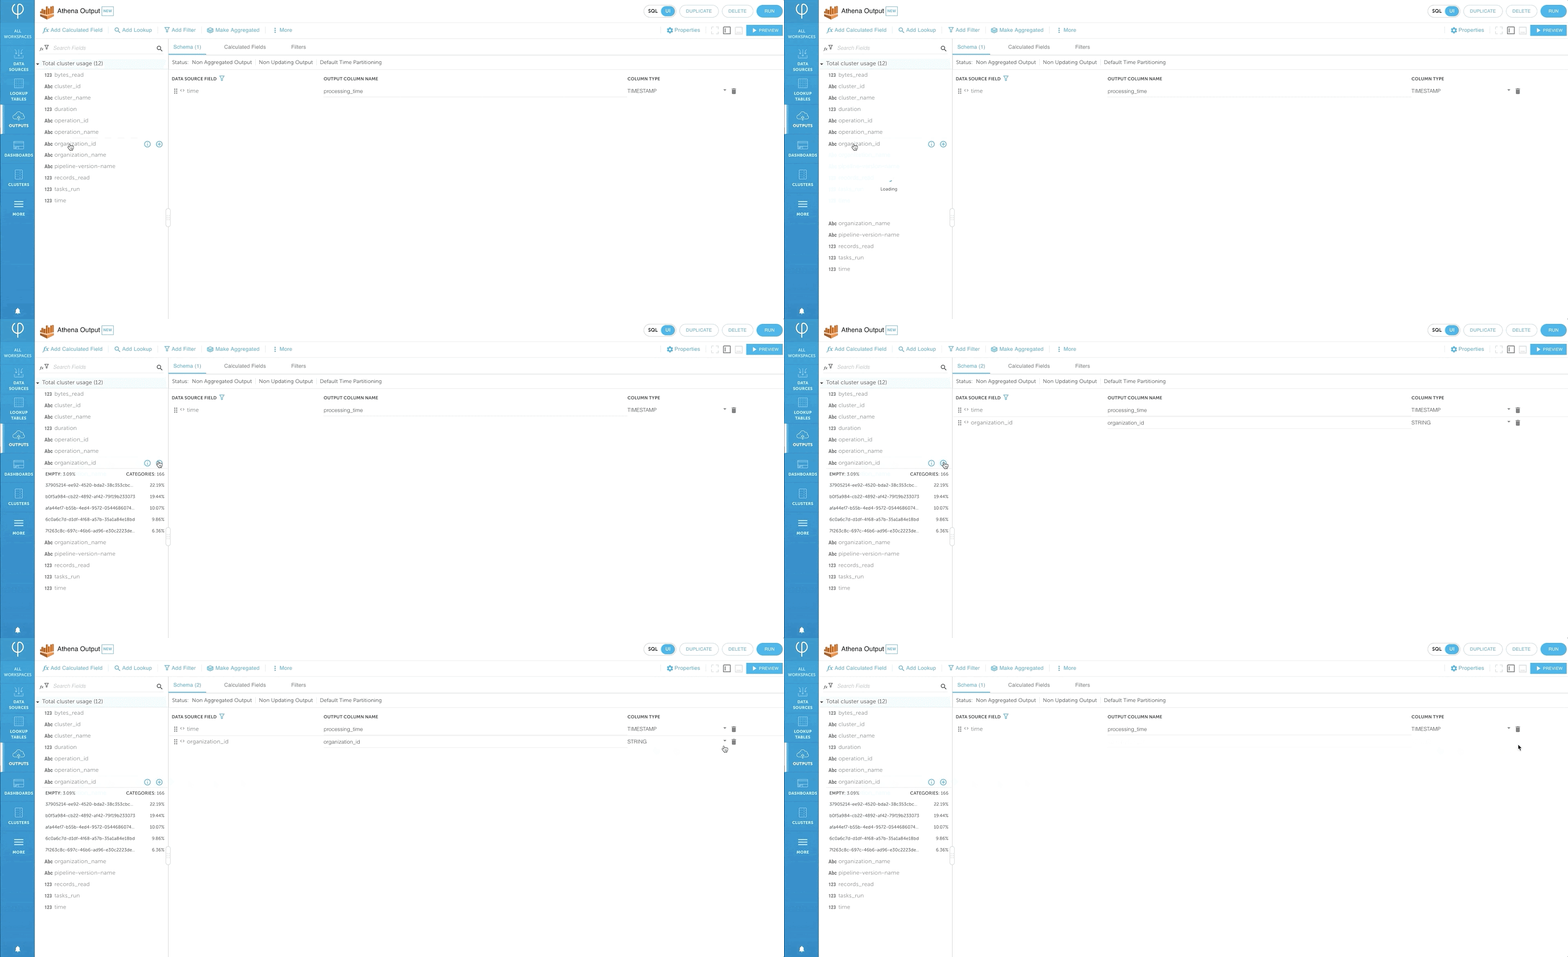
This step is also known as the ETL transformation phase. During this stage, we transform the raw data into queryable data that we can query in Athena. Upsolver offers a visual interface from which you can map the fields from your raw data to columns in your Athena table.
Upsolver also enables you to work with nested data in the same manner.
If you are used to working with SQL, Upsolver enables you to switch between SQL/UI modes and develop your transformations in SQL as well. Read more about that on our blog.
Step 3: Load the transformed data to Athena
Upsolver ETLs are automatically orchestrated whether you run them continuously or on specific time frames. This means there is no need to write orchestration code in Apache Spark or Airflow.
An Upsolver ETL to Athena creates Parquet files on S3 and a table in the Glue Data Catalog. During this process, Upsolver will convert the event files into optimized Apache Parquet and merge small files for optimal performance. When this process is complete, the table you’ve created will instantly be available to query in Athena.
With that – we’re done. We’ve built a continuous ETL pipeline that ingests, transforms, and delivers structured data for analytics, and can easily be duplicated or modified to fit changing needs.
Understanding Data Pipeline Architecture
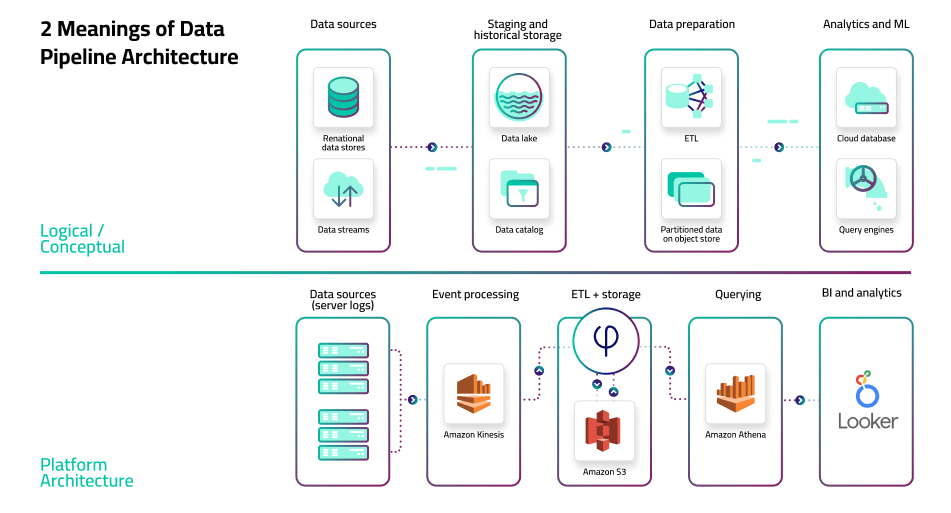
If a data pipeline is a process for moving data between source and target systems (see What is a Data Pipeline), the pipeline architecture is the broader system of pipelines that connect disparate data sources, storage layers, data processing systems, analytics tools, and applications.
In different contexts, the term might refer to:
- The logical architecture that outlines the process and transformations a dataset undergoes, from collection to serving (see data architecture components).
- The specific set of tools and frameworks used in a particular scenario, and the role each of these performs.
In this article, we’ll go back and forth between the two definitions, mostly sticking to the logical design principles, but also offering our take on specific tools or frameworks where applicable.
Why Does Pipeline Architecture Matter? An Example
Business appetite for data and analytics is ever-increasing. The need to support a broad range of exploratory and operational data analyses requires a robust infrastructure to provide the right data to the right stakeholder or system, in the right format.
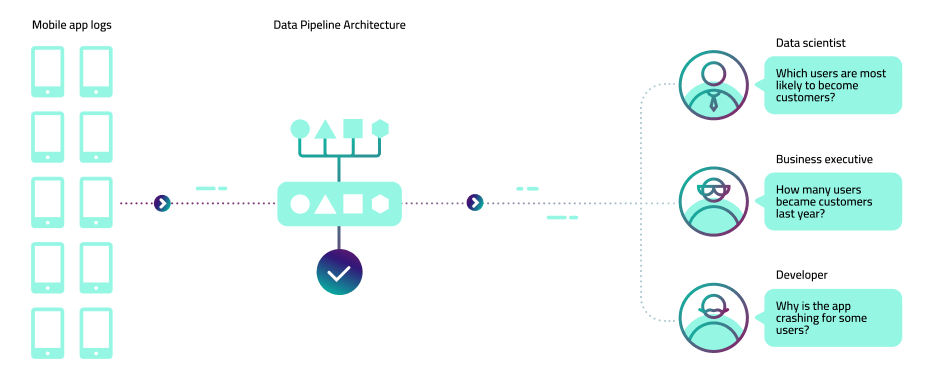
Even a small company might develop a complex set of analytics requirements. Let’s take the example of a company that develops a handful of mobile applications, and collects in-app event data in the process. Multiple people in the organization will want to work with that data in different ways:
- Data scientists want to build models that predict user behavior and to test their hypotheses on various historical states of the data
- Developers want to investigate application logs to identify downtime and improve performance
- Business executives want visibility into revenue-driving metrics such as installs and in-app purchases
This is where the data pipeline architecture comes into play, ensuring all the relevant events are collected, stored, and made available for analysis in a way that is manageable and cost-effective, especially as the scale and number of pipelines increase. Let’s look at what that typical process is composed of, step by step:
Components and Building Blocks
Data infrastructure addresses the full scope of delivering data from the system that generates it to the user who needs it, while performing transformations and cleansing data along the way. This includes:
- Collection: Source data is generated from remote devices, applications, or business systems, and made available via API. Apache Kafka and other message bus systems can be used to capture event data and ensure they arrive at their next destination, ideally without dropped or duplicated data.
- Ingestion: Collected data is moved to a storage layer where it can be further prepared for analysis. The storage layer might be a relational database like MySQL or unstructured object storage in a cloud data lake such as AWS S3. At this stage, data might also be cataloged and profiled to provide visibility into schema, statistics such as cardinality and missing values, and lineage describing how the data has changed over time. Read more about ingestion pipelines.
- Preparation: Data is aggregated, cleansed, and manipulated in order to normalize it to company standards and make it available for further analysis. This could also include converting file formats, compressing and partitioning data. This is the point at which data from multiple sources may be blended to provide only the most useful data to data consumers, so that queries return promptly and are inexpensive.
- Consumption: Prepared data is moved to production systems – analytics and visualization tools, operational data stores, decision engines, or user-facing applications.
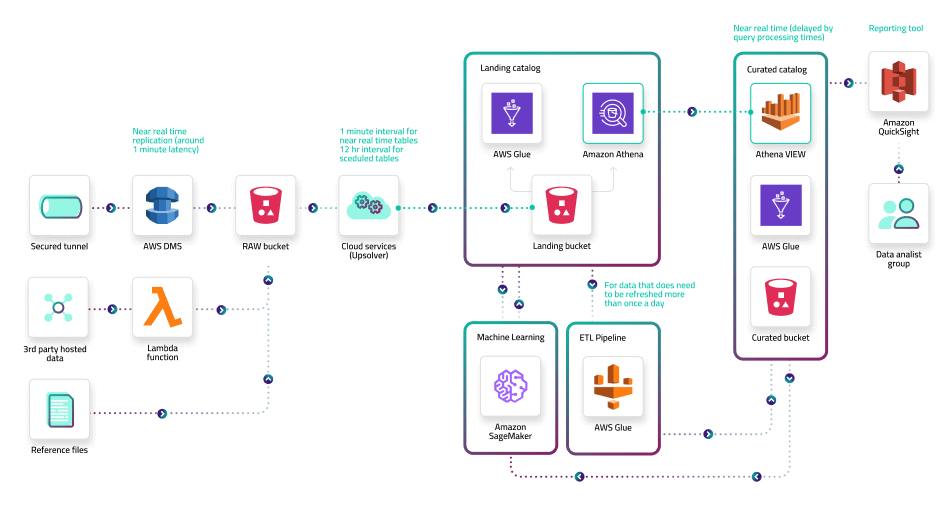
To see how all of these components come into play, see this reference architecture take from our latest case study: How Clearly Drives Real-Time Insights.
Note that multiple steps might be handled by the same tooling or code and tools may not line exactly to the four stages. For instance, preparation may occur upon ingestion (basic transformations), preparation (intensive operations like joins), and consumption (a BI tool may perform an aggregation).
Common Architecture Patterns for Data Pipelining
The number of ways to design a data architecture is endless, as are the choices that can be made along the way – from hand-coding data extraction and transformation flows, through using popular open-source frameworks, to working with specialized data pipeline platforms.
Despite this variance in details, we can identify repeating design principles and themes across data architectures:
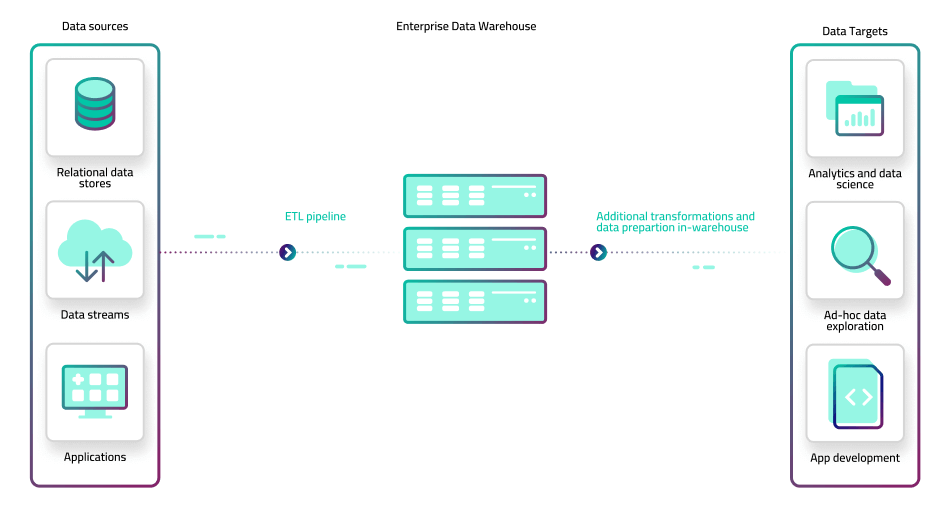
1. ETL pipelines centered on an enterprise data warehouse (EDW)
This is the traditional or ‘legacy’ way of dealing with large volumes of data. The organization rallies around a single, monolithic data warehouse, perhaps supplemented with some smaller, domain-specific data marts. Central IT and data engineering teams are responsible for building the pipelines to move data from source systems and ingest it into the warehouse in a consistent schema, as well as joining disparate datasets to enable deeper analytics.
Additional IT teams would work with analysts that query the data warehouse using SQL. Analytical or operational consumption needs to be supported while ensuring data remains available and preventing disruption to production environments. Each new use case or change to an existing use case requires changes to the data pipeline, which would need to be validated and regression tested before being moved to production.
The main advantage of this architecture is that data is highly consistent and reliable, and the organization is truly working off of a single source of truth (as there is literally a single source). However, it is a very brittle architecture that creates significant technical debt at every step of the process. ,IT bottlenecks invariably form because every change to a report or query requires a laborious process managed by the same overloaded teams.
Another drawback is that data warehouses are built for structured, batch-oriented data and much of the world is moving to streaming and complex (semi-structured) data.
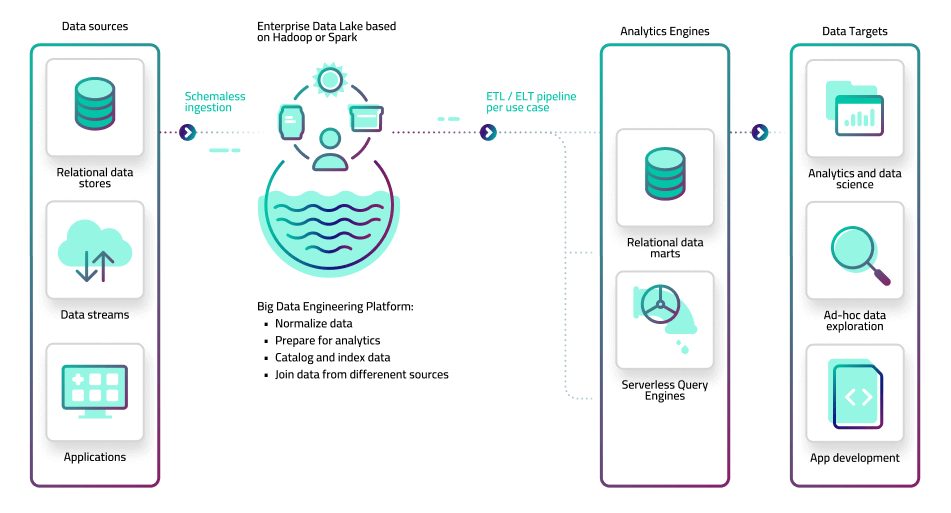
2. Centralized data lake and big data platform (lake house)
In this architecture, the monolithic data warehouse has been replaced with a data lake. Large volumes of data from different sources can now be easily ingested and stored in an object store such as Amazon S3 or on-premise Hadoop clusters, reducing the engineering overhead associated with data warehousing. The data lake stores data in its original, raw format, which means it can store complex and streaming data as easily as structured, batch files.
However, raw data in the lake is not in a queryable format, which necessitates an additional preparation layer that converts files to tabular data. The big data platform – typically built in-house using open source frameworks such as Apache Spark and Hadoop – extracts the data from object storage, runs transformation code, and serves it onwards to analytics systems. These can be physical databases such as RDS, data warehouses such as Redshift or Snowflake, single-purpose systems such as Elasticsearch, or serverless query engines such as Amazon Athena or Starburst. BI and analytics tools would connect to these databases to provide visualization and exploration capabilities.
The advantage of this approach is that it enables organizations to handle larger volumes and different types of data than an EDW would allow for, using a ‘store now, analyze later’ approach. The drawback is that much of that complexity moves into the preparation stage as you attempt to build a data hub or “lake house” out of the data lake. It is a highly specialized engineering project toiled over by teams of big data engineers, and which is typically maintained via a bulky and arcane code base. Agility is thus rarely achieved, and data pipeline engineering is once again a time and resource sink.
3. Siloed data domains (walled gardens)
The proliferation of SaaS-based cloud databases and managed data pipeline tools have enabled business units to deploy their own data pipelines, without the involvement of a centralized IT team. For example, a marketing department might find it can answer its own data requirements using tools such as Fivetran for ingestion, Snowflake for storage and consumption, and Tableau for presentation.
Each business domain locally optimizes based on its requirements and skills, and is responsible for its own pipeline architecture, with problems often solved using proprietary technologies that do not communicate with each other, with the potential of multiple departments generating data sets from the same source data that are inconsistent due to using different logic.
The advantage of this approach is that it provides a high level of business agility, and each business unit can build the analytics infrastructure that best suits their requirements. The data engineering bottleneck is largely averted (at first) as there is no centralized organization responsible for pipeline building and maintenance.
This type of architecture is often seen at smaller companies, or in larger ones with poor data governance. Its main drawback is in the inconsistencies that will inevitably form when each team is working with its own copy of the data and performing further manipulations and transformations on that data. It will quickly become apparent that no two teams see the same data, and attempts to reconcile these differences often involve the same data engineering challenges as before. Also, unless the department has skilled data engineers, the pipelines will be limited to simple use cases (BI dashboard).
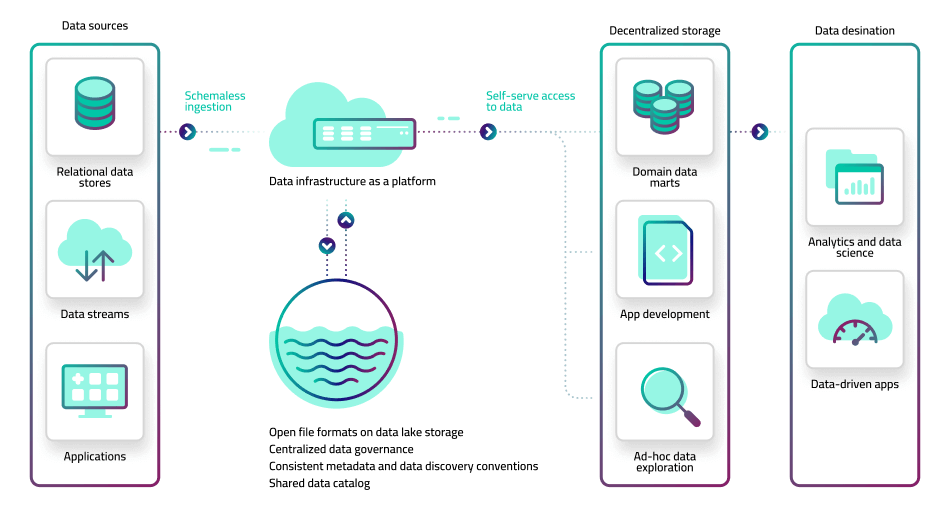
4. Open decoupled architecture (data mesh)
The modern approach to data pipeline engineering aims to provide a better balance between centralized control and decentralized agility. In this model, each domain area works with its own data using the best available technologies, tooling, and technical resources at its disposal; however, source data is made available via an open data lake architecture, predicated on open file formats and analytics-ready storage. This is sometimes referred to as a data mesh.
In this architecture, raw data is ingested into object storage with minimal or no preprocessing, similar to the data lake approach. Different teams can then pull the data out of the lake and run their own ETL or ELT pipeline in order to deliver the dataset they need for further analysis. Data is then written back to the lake in an open file format such as Apache Parquet, while preparing the data using consistent mandated conventions and maintaining key attributes about the data set in a business catalog. This offers the benefits of having decentralized data domains but with a level of central governance to ensure it can be discovered and used by other teams, and without forcing a centralized data team to manage every inbound or outbound pipeline.
The advantage of this approach is that it enables both business and tech teams to continue work with the tools that best suit them, rather than attempt to force a one-size-fits-all standard (which in practice fits none).
The drawback, besides the mindset change required by central teams, is that you still have decentralized data engineering which can exacerbate the bottleneck problem by spreading talent too thinly. This can be ameliorated by using low-code data pipeline tools.
Discover Upsolver: The SQL Pipeline for Complex Data
We hope you’ve found this guide useful. If you’re ready to go from theory to practice and start building powerful data pipelines on your cloud data lakes, Upsolver is the tool for you. Request a demo to learn why industry leaders such as Traeger, ironSource and Wix choose Upsolver to ingest and transform their complex and streaming data.
